How to Create Interactive Charts with Dynamic Elements in Excel

Written by

Reviewed by
This tutorial will demonstrate how to create interactive charts with dynamic elements in all versions of Excel: 2007, 2010, 2013, 2016, and 2019.
In this Article
- Excel Interactive / Dynamic Charts – Free Template Download
- Sample Data
- How to Create a Dynamic Chart Title
- How to Create a Dynamic Chart Range
- How to Create an Interactive Chart with a Drop-Down List
- Step #1: Lay the groundwork.
- Step #2: Add the drop-down list.
- Step #3: Link the drop-down list to the worksheet cells.
- Step #4: Set up the chart data table.
- Step #5: Set up a chart based on the dynamic chart data.
- How to Create an Interactive Chart with a Scroll Bar
- Step #1: Lay the groundwork.
- Step #2: Draw the scroll bar.
- Step #2: Link the scroll bar to the worksheet data.
- Step #3: Create the chart data table.
- Step #4: Create a chart based on the helper table.
- Download Excel Interactive / Dynamic Charts Template
Excel Interactive / Dynamic Charts – Free Template Download
Download our free Interactive / Dynamic Charts Template for Excel.
An interactive chart is a graph that allows the user to control which data series should be illustrated in the chart, making it possible to display or hide data by using form controls. These come in many shapes and forms, ranging from option buttons to scroll bars and drop-down lists.
In turn, making some chart elements dynamic—such as the chart title—makes it possible to automate the process of updating your graphs whenever you add or remove items from the underlying source data.
So, creating interactive charts with dynamic elements allows you to kill two birds with one stone.
To start off with, interactive charts help you neatly display massive amounts of data with only one graph:
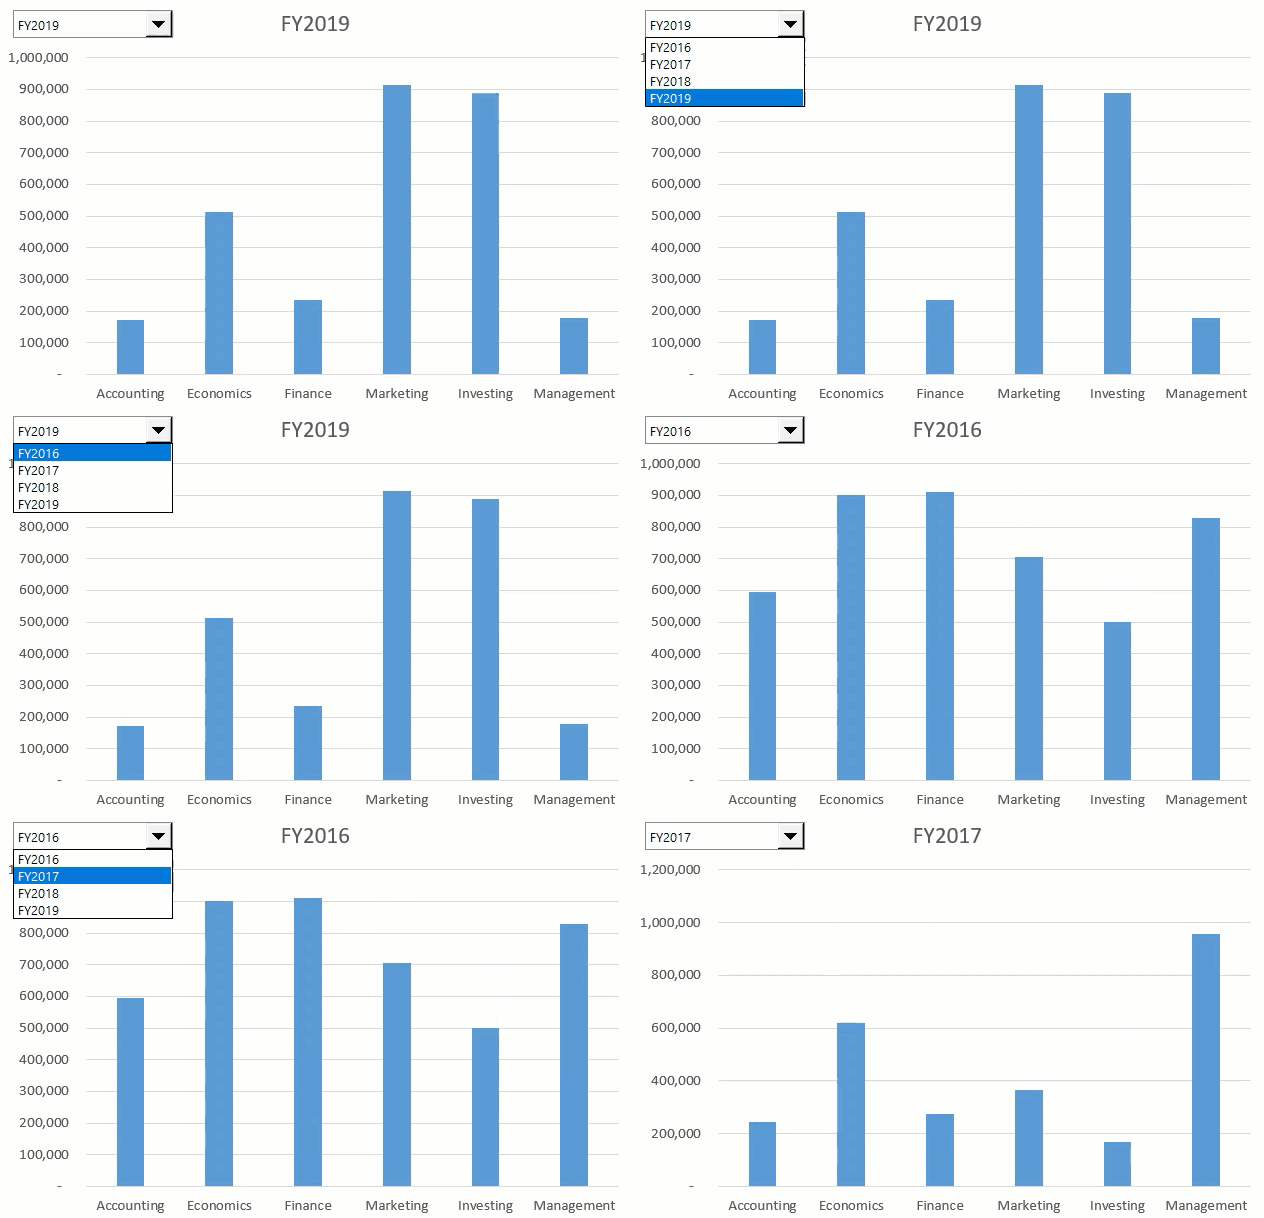
In addition, turning some chart elements from static to dynamic saves countless hours in the long run and prevents you from ever forgetting to update the chart whenever you alter your data table.
That being said, this tutorial is a crash course into advanced chart-building techniques in Excel: you will learn how to create interactive charts both with a drop-down list and with a scroll bar as well as master the ways to make your chart title and chart data range dynamic.
Sample Data
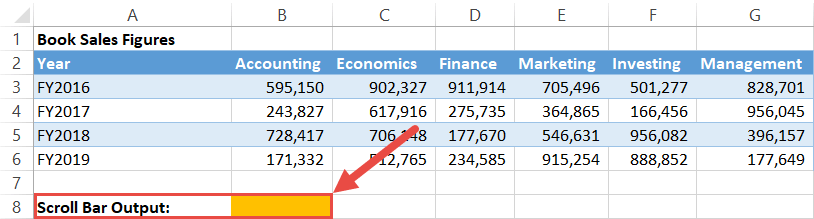
To show you what’s what, we need some raw data to work with. For that reason, consider the following table illustrating book sales figures of a fictitious online bookstore:
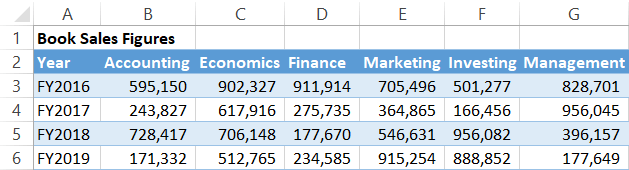
Download our free Interactive / Dynamic Charts Template for Excel.
How to Create a Dynamic Chart Title
Let’s tackle the easy part first: making your chart title dynamic.
You can make the title dynamic by linking it to a specific cell in a worksheet so that any changes to the value in that cell is automatically reflected in the chart title.
And the beauty of this method is that it takes just a few easy steps to turn your chart title from static to dynamic:
- Double-click on your chart title.
- Click the Formula Bar and type “=” into it.
- Select any cell to assign it as your new chart title.
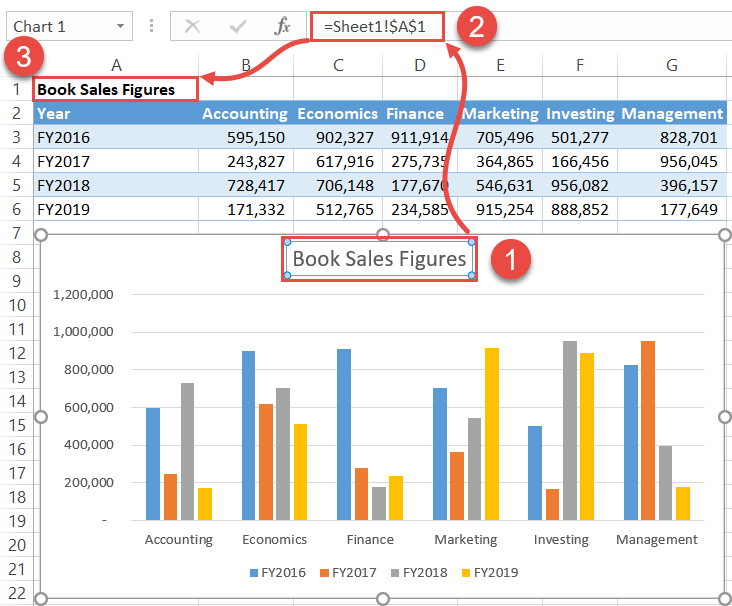
At first glance, the idea seems quite primitive. But we have barely even scratched the surface of the things made possible by applying this simple technique. To learn more, check out the in-depth tutorial covering dynamic chart titles in Excel more exhaustively.
How to Create a Dynamic Chart Range
Next up: setting up a dynamic chart range. Again, conventionally, every time you add or remove items from the data range used in building an Excel chart, the source data should be manually adjusted as well.
Luckily, you can save yourself the hassle of having to deal with all of that by creating a dynamic chart range that automatically updates the chart each time the source data is altered.
Essentially, there are two ways to go about it: the table method and the named ranges technique. We are going to briefly cover the easier table method here, but to get a full grasp of how to harness the power of dynamic chart ranges in Excel, check out the tutorial covering all the ins and outs in greater detail.
Anyway, back to the table method. First, turn the cell range you want to use for building a chart into a table.
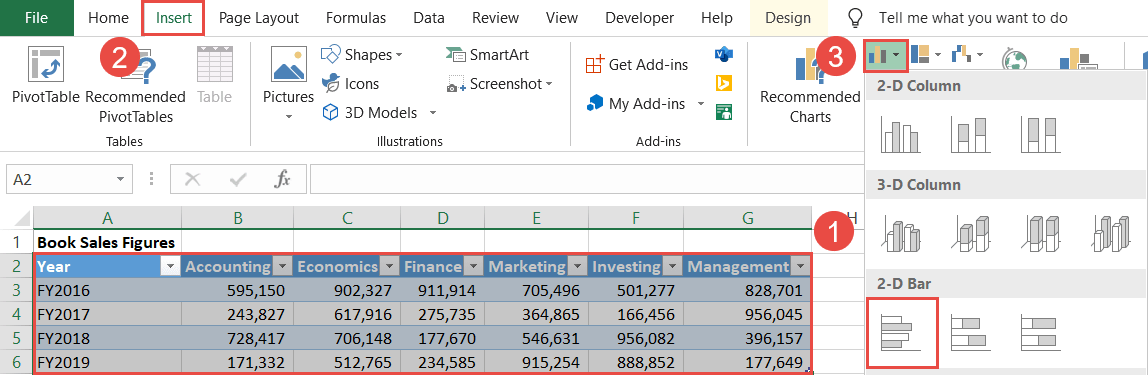
- Select the entire data range (A2:G6).
- Head over to the Insert tab.
- Click the “Table” button.
If your data doesn’t have any headers, uncheck the “My table has headers” box.
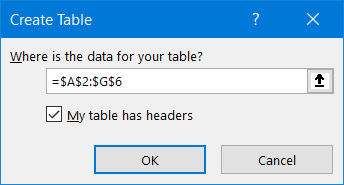
Once there, the data range will be converted into a table.

Now, all you need to do is plot your chart while using the table as the chart’s source data:
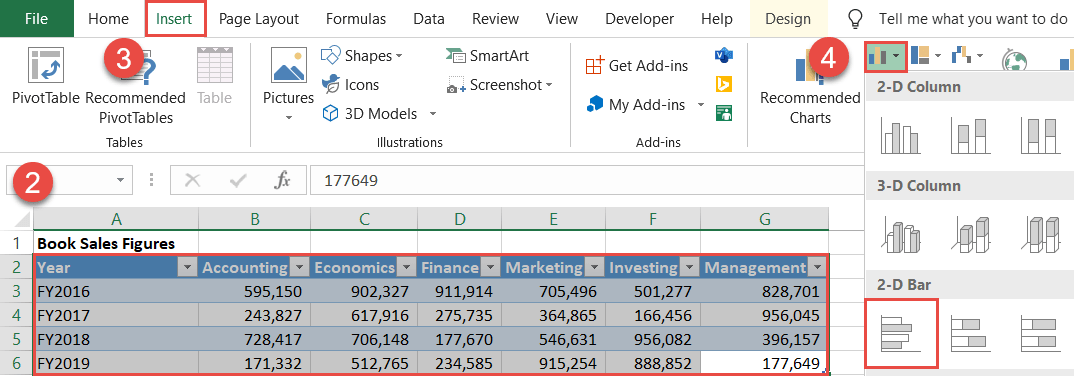
- Highlight the table (A2:G6).
- Navigate to the Insert tab.
- Create any 2-D chart—for instance, a clustered bar chart (Insert Column or Bar Chart > Clustered Bar).
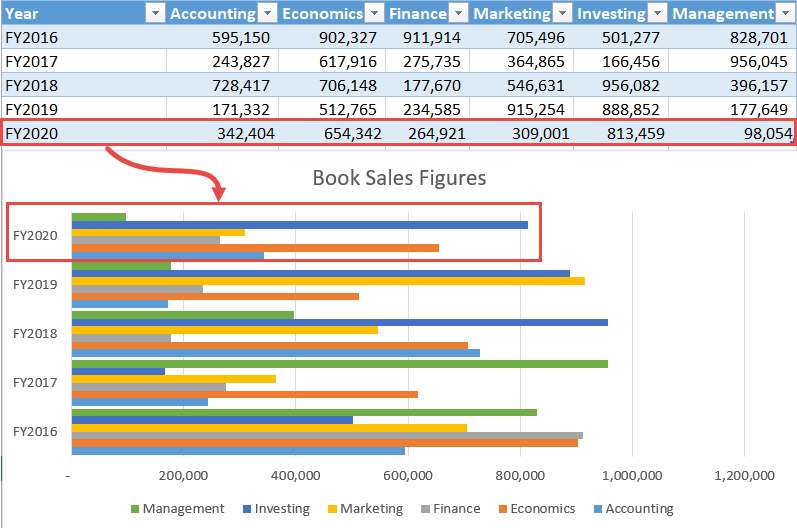
Voilà! You’re all set. Now, test it out by inserting new items into the table to see them automatically recharted on the graph.
How to Create an Interactive Chart with a Drop-Down List
Now that you’ve made your first steps into the realm of advanced data visualization tools in Excel, it’s time to move on to the hard part: interactive Excel charts.
When you have a lot of data to chart, introducing interactive features to your Excel graphs—be it drop-down lists, check boxes, or scroll bars—helps you preserve dashboard space and declutter the chart plot while making it more comfortable for the user to analyze the data.
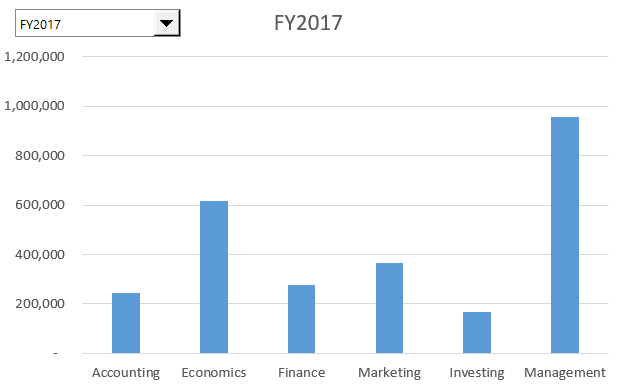
As an example, take a look at the column chart shown below. Instead of showing a messy graph containing the entire data table, opting for this interactive chart with a drop-down list allows the user to zoom in on the sales figures for a certain year in just two clicks.
Just follow the detailed steps outlined below to learn how you can do the same thing.
Step #1: Lay the groundwork.
Before we begin, access the Developer tab that contains some of the advanced Excel features we are going to turn to further down the road. The tab is hidden by default, but it only takes a few clicks to add it to the Ribbon.
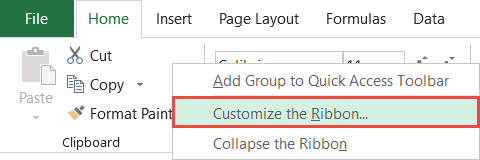
First, right-click on any empty space in the Ribbon and select “Customize the Ribbon.”
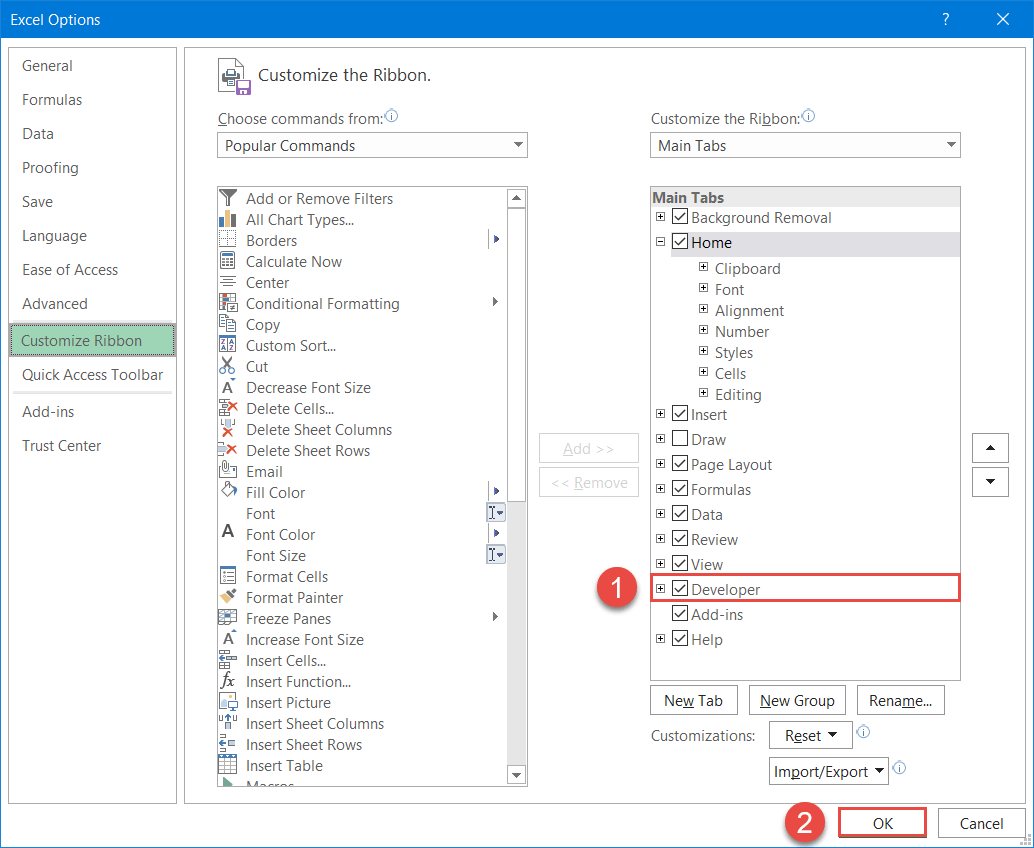
In the Excel Options dialog box, navigate to the Main Tabs list, check the “Developer” box, and hit “OK.”
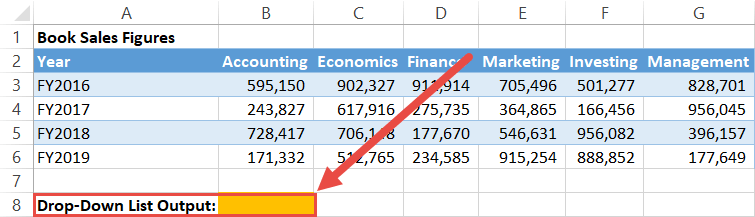
The Developer tab should now show up on the Ribbon. At this point, pick any empty cell for displaying the drop-down menu output (B8). This will help Excel show the right data based on what option is selected from the drop-down list.
Step #2: Add the drop-down list.
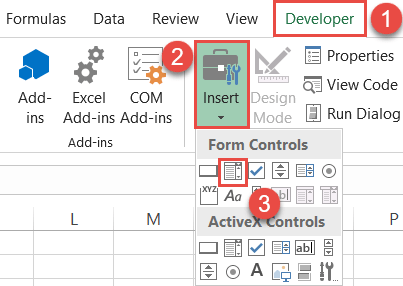
Our next step is to add the drop-down menu to the worksheet:
- Go to the Developer tab.
- Click “Insert.”
- Under “Form Controls,” select “Combo Box.”
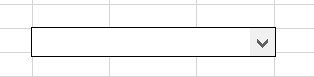
Draw that empty combo box anywhere you want. To illustrate, here is what an empty drop-down menu looks like:
Step #3: Link the drop-down list to the worksheet cells.
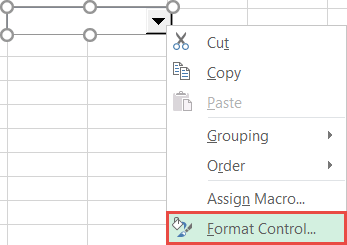
In order for the menu to import the list of the years in the data table, you have to link it to the respective data range in the worksheet. To do that, right-click on the combo box and choose “Format Control.”
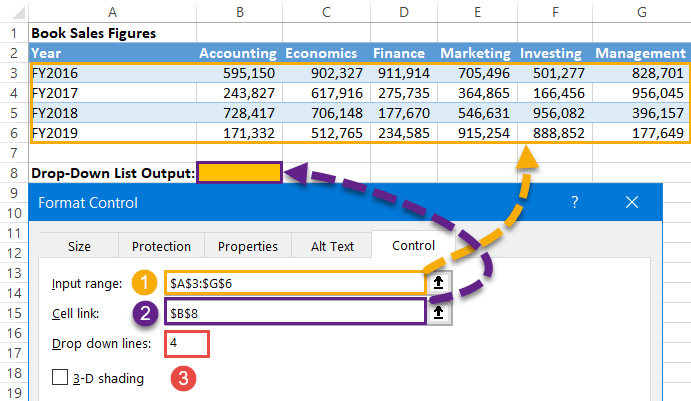
In the dialog box, do the following:
- For “Input range,” highlight all the actual values in the data table ($A$3:$G$6).
- For “Cell link,” select the empty cell assigned for storing the drop-down menu output ($B$8).
- For “Drop down lines,” enter the number of data points in your data set (in our case, four) and click “OK.”
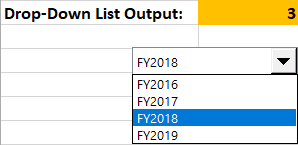
This action should result in the names of the data points being added to the drop-down list while the helper cell value (B8) characterizes the currently selected item from the menu as option 1, 2, 3, or 4:
Step #4: Set up the chart data table.
Since the chart should illustrate only one data series at a time, as a workaround, set up a dynamic helper table that will sift through the raw data and return solely the sales figures for the year picked from the list.
That table is going to be eventually used as the chart’s source data, effectively enabling the user to switch views with the drop-down menu.
First, copy the header of the sales data table and leave an empty row for displaying the filtered sales figures.
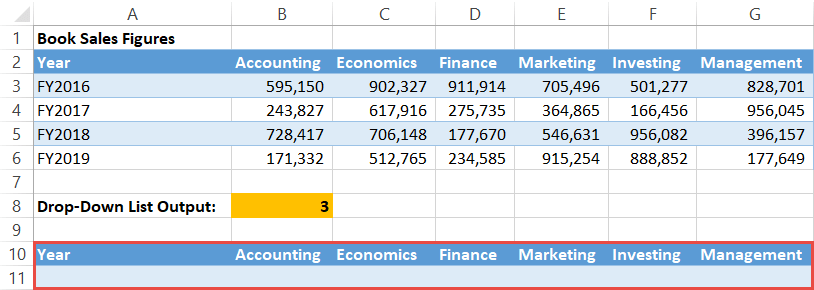
But how do you make sure the data gets extracted correctly? That’s where the INDEX function comes into play. Enter the following formula into A11 and copy it across to G11:
=INDEX(A3:A6, $B$8)Basically, the formula filters through column Year (column A) and returns solely the value in the row which number corresponds to the currently selected item in the drop-down list.
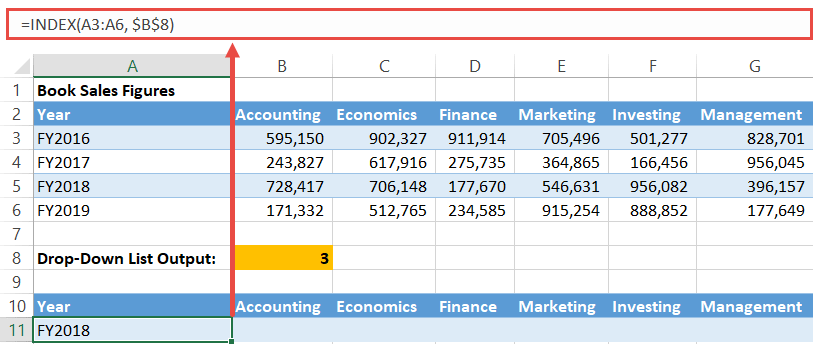
Step #5: Set up a chart based on the dynamic chart data.
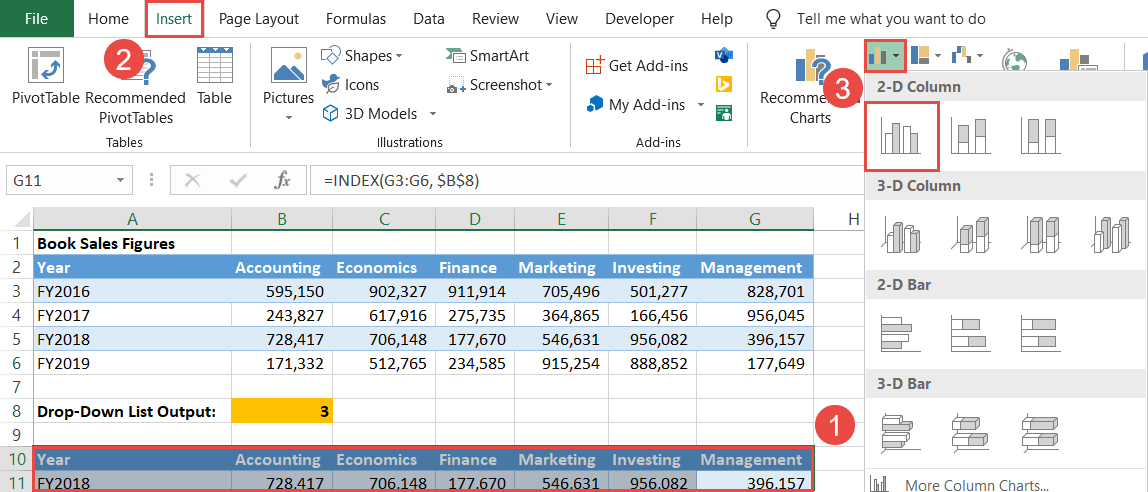
You’ve made it through the hardest part, so all that’s left to do is to create a 2-D chart based on the helper table (highlight the helper table [A10:G11] > Insert > create a clustered column chart).
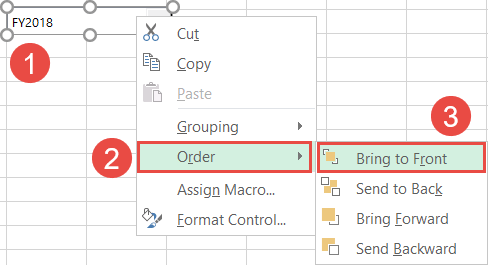
As a final touch, if you want the drop-down menu to be placed on top of the chart, right-click on the combo box, click “Order,” and choose “Bring to Front.” (Alternatively, right-click on the chart plot, click “Order,” and choose “Send to Back.”)
That’s it! There you have your interactive column chart linked to the drop-down menu.
How to Create an Interactive Chart with a Scroll Bar
Truth to tell, the process of adding a scroll bar to your Excel charts is similar to the steps outlined above.
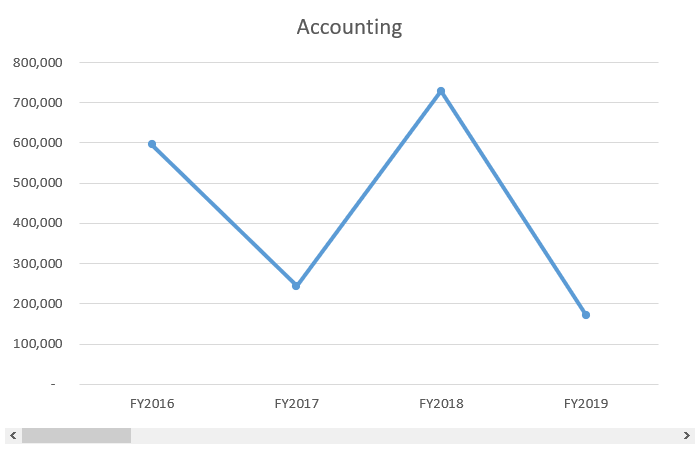
But what if you want to analyze the sales dynamics of each book category (the columns), as opposed to displaying the annual sales figures (the rows)? To illustrate, take a look at the interactive line chart below doing just that:
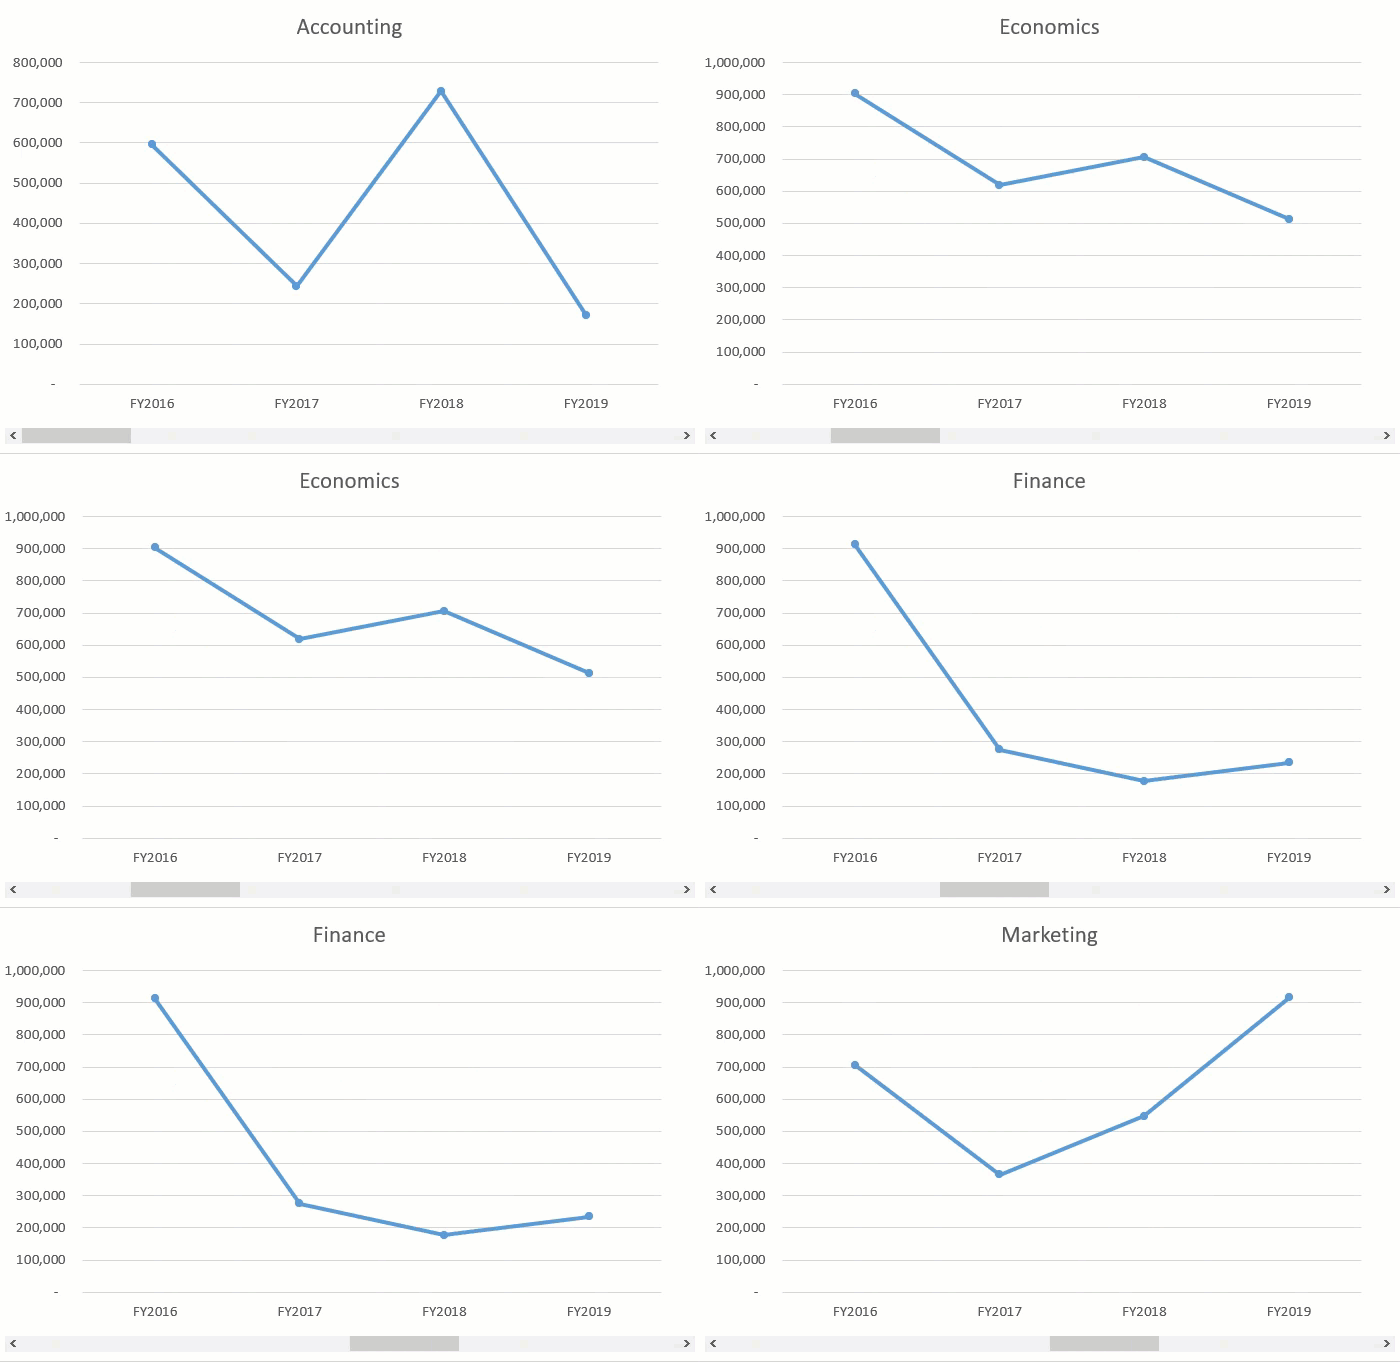
How do you pull it off? Well, that’s where things start getting a bit more complex. However, if you just stick to the step-by-step process below, following the instructions should feel like a walk in the park, even if you are a complete newbie.
Step #1: Lay the groundwork.
Before you begin, add the Developer tab to the Ribbon, as that contains the feature that allows us to draw a scroll bar (right-click on any empty space in the Ribbon > customize the Ribbon > Main Tabs > check the “Developer” box > OK).
To make things work like clockwork, assign an empty cell for displaying the scroll bar output so that Excel can correctly position the scroll box in the scroll bar (B8).
Step #2: Draw the scroll bar.
Our next step is to insert the scroll bar into the worksheet:
- Go to the Developer tab.
- Hit the “Insert” button.
- Under “Form Controls,” select “Scroll Bar.”
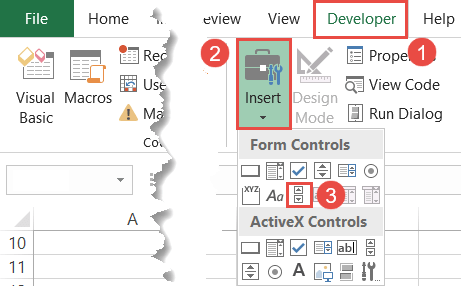
At this point, you can draw the scroll bar wherever you want. We will move it into place later.
Step #2: Link the scroll bar to the worksheet data.
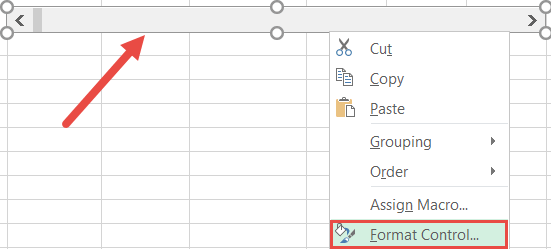
Right-click on the scroll bar and select “Format Control.”
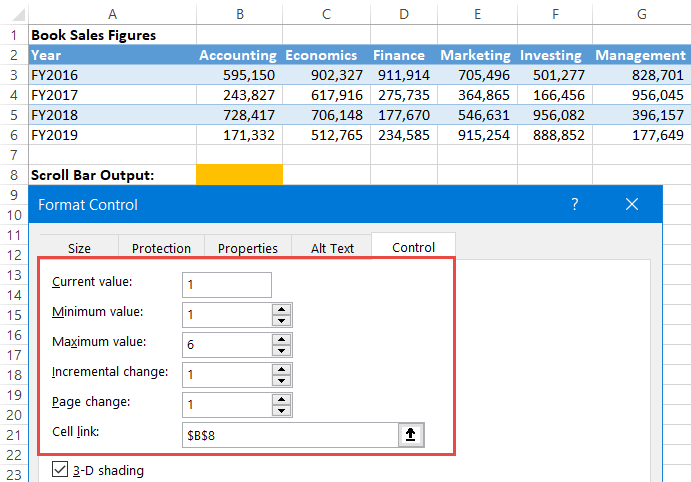
In the Format Control dialog box, modify the settings of the scroll bar:
- Current value: This value defines the default position of the scroll box in the scroll bar. Set the value to “1.”
- Minimum value: This setting signifies the lowest value of the scroll bar. In our case, type “1” into the field.
- Maximum value: This parameter determines the highest value of the scroll bar and should correspond with the number of data points to be used for plotting the interactive chart. Since the data table is comprised of six book categories, change the value to “6.”
- Incremental change: This value determines how smoothly the scroll box changes its position when you move it. Always set the value to “1.”
- Page change: This value determines how smoothly the scroll box changes its position when you click the area between the scroll box and the arrows. Always set the value to “1.”
- Cell link: This value characterizes the current position of the scroll box. Simply highlight the cell in the worksheet previously assigned for this purpose ($B$8).
Step #3: Create the chart data table.
Once you have finished the setup process, create a new helper table for storing the dynamic chart data extracted from the raw data. The chart data will automatically adjust the values depending on the current position of the scroll box—effectively linking the scroll bar to the chart plot.
To do that, start with copying column Year as shown on the screenshot below (A2:A6).
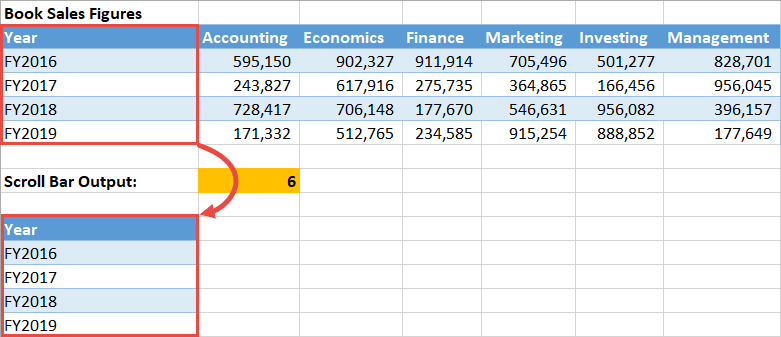
Once there, deploy the following INDEX function that picks the cell range containing the book category names and returns a corresponding value based on the position of the scroll box.
Type the following formula into cell B10:
=INDEX($B$2:$G$2, $B$8)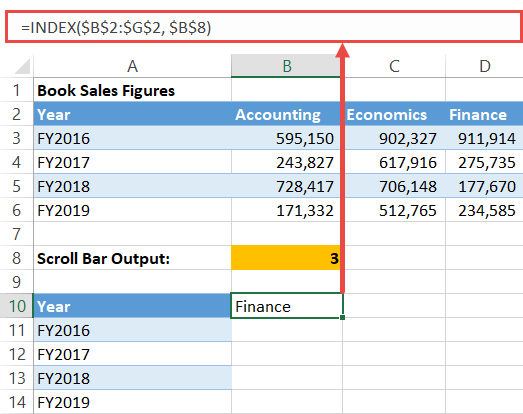
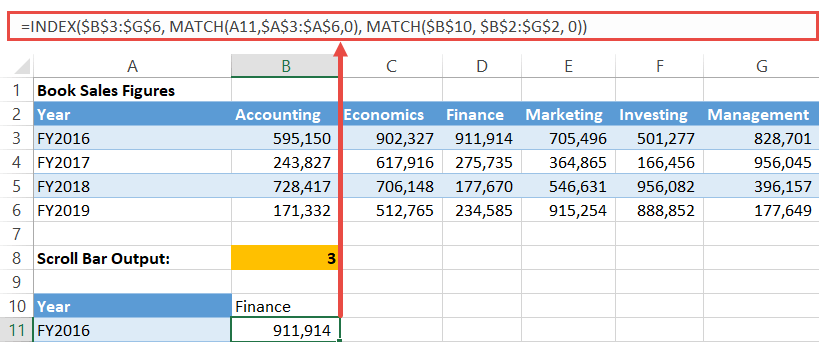
Now, import the sales figures corresponding to the current book category by entering this formula into B11 and copy it down (B11:B14):
=INDEX($B$3:$G$6, MATCH(A11,$A$3:$A$6,0), MATCH($B$10, $B$2:$G$2, 0))The combination of INDEX and MATCH functions helps to accurately return the value of which row and column number matches the specified criteria.
The formula first filters through column Year ($A$3:$A$6) and picks the row that matches the corresponding year in the helper table (A11). Then, the formula sifts through the book category names in the same manner ($B$2:$G$2). As a result, the formula returns the correct dynamic value which adjusts whenever you move the scroll box.
Step #4: Create a chart based on the helper table.
Once the chart data table has been put together, just build a simple chart to see the scroll bar in action.
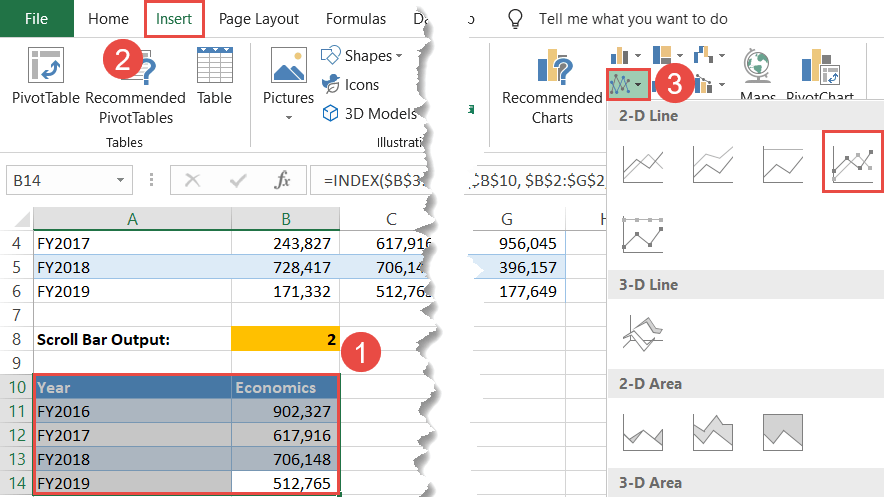
Highlight the entire helper table (A10:B14), go to the Insert tab, and plot any 2-D chart—for instance, a line chart (Insert Line or Area Chart > Line with Markers).
NOTE: If you want the scroll bar to be displayed on top of the chart, right-click on the scroll bar, choose “Order,” and select “Bring Forward.” (Alternatively, right-click on the chart plot, click “Order,” and choose “Send to Back.”)
And that’s how you do it. You have just learned everything you need to know about the powerful advanced techniques that will up your data visualization game by leaps and bounds.
Download Excel Interactive / Dynamic Charts Template
Download our free Interactive / Dynamic Charts Template for Excel.